Infrared Spectroscopy
- Spectroscopy is based upon the idea of measuring the energy needed to produce a change from one energy level to another.
- The energy possessed by chemical particles is quantised; there can only be a number of definite energy values, rather than a whole range of energy values.
- Infrared spectroscopy takes advantage of the vibrational energy changes that occur in molecules when they are exposed to infrared radiation (1014 – 1013 Hz).
-
Frequency and Wavelength are related to each other:
C = v
v
(C = Speed of Light)
-
The Wavenumber is the reciprocal of the wavelength (1/
 ), and thus is a direct measure of the frequency.
Interaction between Infrared radiation and molecules
-
The bonds in simple diatomic molecules (HCl, HI, HBr…) can only vibrate by stretching:

- For these molecules there is only one infrared absorption. The energy of this corresponds to the molecules changing from their lowest vibrational energy level, to the next higher one.
- The energy needed to excite a vibration is different for each molecule; this is because this energy is related to the bond strength (weaker bonds require less energy to vibrate than stronger ones).
-
Thus the frequencies of infrared absorption differ for each molecule.

- In more complex molecules, there are more ways in which bond deformations are possible. Most of these more complex molecules involve more than two atoms.
-
Carbon dioxide can vibrate in the following ways:

- Below 1500cm-1 there is a very detailed “fingerprint” region which can be used with a database of infrared spectra for identification by comparison.
- Even more complex molecules have more vibrational modes. These are sometimes labelled by the descriptions (rocking, scissoring, twisting and wagging).
- All these vibrational modes and the fact that different bonds have different energies lead to infrared spectrums being very complicated.
- Not all of the spectrum has to be identified however, only one or two peaks may need to be identified.
- The peaks are characteristic of specific bonds.
-
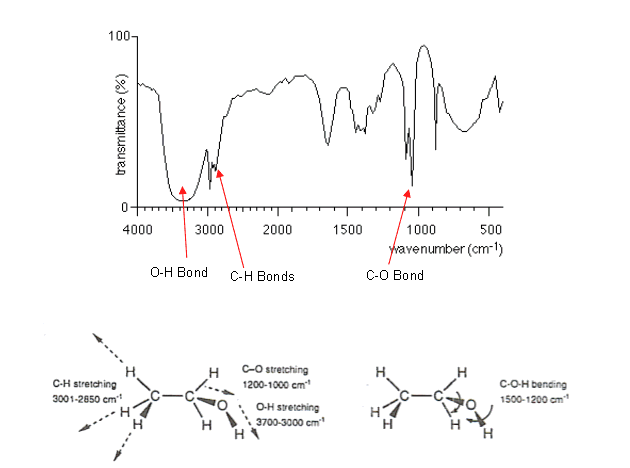
Below is the infrared spectrum of ethanol with some identified fingerprints:

How the Infrared Spectrometer works
- Infrared radiation from a heat source is split into two beams.
- One of the beams goes through the sample, and the other goes through a reference chamber, ensuring that absorptions from water and carbon dioxide in the air are cancelled out.
- The beams are then sent along the same path, in separate alternating pulses, achieved using a beam chopper (rotating disc with segment cut out of it).
- The beams are then analysed by passing them through a sample of sodium chloride or potassium chloride (both invisible to IR radiation) or through a diffraction grating.
- Only light of one particular frequency is allowed to focus onto the detector at one time.
- The spectrum is achieved by scanning the frequencies and recording the associated light intensities.
- When the sample is not absorbing, there will be no difference between the alternating pulses reaching the detector, so no signal is recorded.
- When a vibration is being excited, the sample beam intensity will be reduced and a signal generated.
- The record of an IR spectrum seems to be upside down (the baseline is at the top); however it is transmittance that is being recorded and this is at a maximum when no light is being absorbed.
Interpreting the Spectra
-
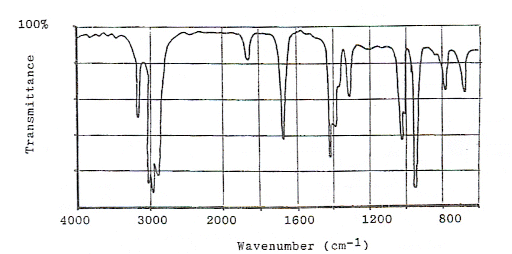
Below is the infrared spectra of oct-1-ene, which shows most of the characteristic absorptions of a hydrocarbon.

- The peaks on the spectrum can be identified using the absorption energies in the data book.
- The C-H absorption arises at around 3000 cm-1 (the shoulder of the stronger and broader absorption of the OH bond (see ethanol’s spectrum))
-
The OH absorption is more intense in the ethanol spectrum even though there are five times as many C-H bonds as OH bonds.
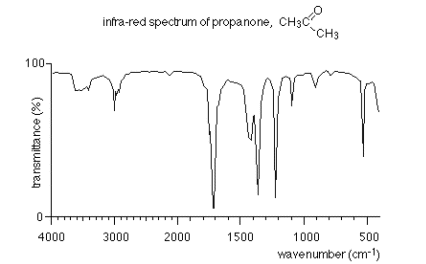
Likewise, in the spectrum of propanone the C=O bond (1720 cm-1) is very intense compared with the C=C bond in octene.

- These differences in intensities are because the strongest absorptions arise when there is a large change in bond polarity associated with the vibration.
- Hence polar bonds such as O-H, C-O and C=O give more intense absorptions than non-polar C-H, C-C and C=C bonds.
Example analysis of a compound
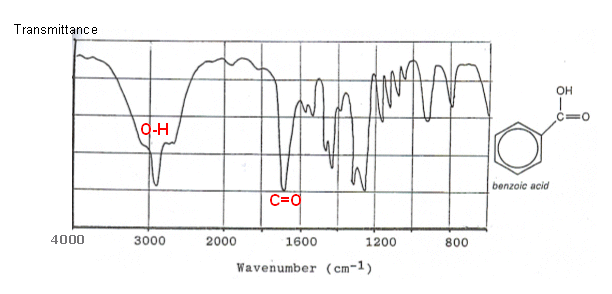
The infrared spectrum of benzoic acid is shown below:

- An O-H group is present in the molecule (identified by the region between 2500-3300 cm-1)
- Absorption between 1680-1750 shows that a C=O is present.
- Absorption around 1300 cm-1 again shows the presence of an OH group.
-
Absorption around 900-1100 cm-1 could be due to the benzene ring or to the carbon-oxygen bond of the acid grouping.
Useful books for revision
Revise A2 Chemistry for Salters (OCR A Level Chemistry B)
Salters (OCR) Revise A2 ChemistryHome